
At Red Car Analytics, we love our building energy models, although we are the first to admit that getting real value out of a model can be as much an art as science. I recently gave a presentation about finding the value in building energy modeling, sharing some of my experience working in this space for over 12 years. I hope that it will inspire others out there.
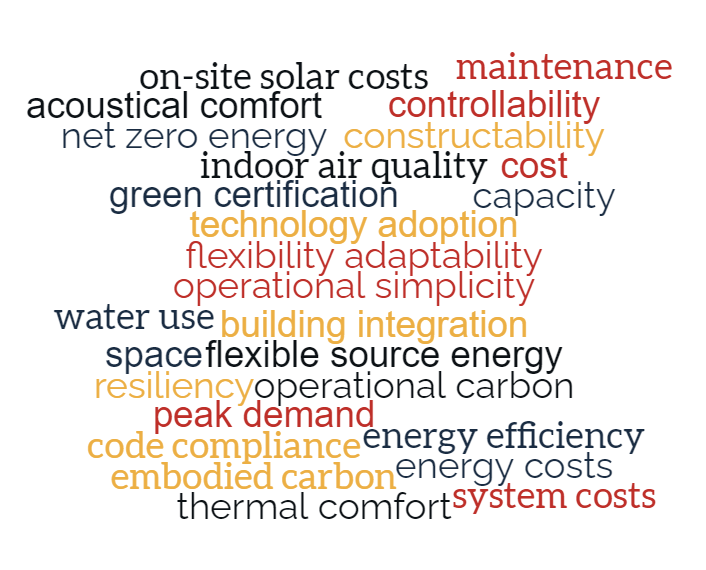
Energy modeling or building analysis has been around for a long time. Ultimately, the goal is to analyze ENERGY. Yet, there are many interpretations about what an energy model should illustrate. As an energy modeler, I remember thinking, ‘if only we could streamline our reports,’ or ‘if only we could teach everyone the same energy metrics,’ or, ‘if only our clients wanted all the values we could demonstrate.’ At one point, just to make sense of it all, I made a list of the different value propositions we have used over the years (shown in this word cloud).
It took me years to understand that while every project fundamentally might share the same aspirational goals (low energy, low carbon), clients have different priorities and motivating values. In the long run, their values are the most important as they make investment decisions and changes to a building. And, it’s not to suggest they don’t also want all the other values; usually, everyone does. However, the question becomes, are they willing to make changes to achieve them and whether it matters enough to spend the time and costs involved.
Let’s look at three examples of how different values might motivate different building design teams:
- Public buildings: These are often motivated by low operating cost, robust and simple systems since there may not be full-time maintenance staff unless something breaks;
- Private built-to-suite buildings: For very specific business, often for corporations wishing to demonstrate environmental stewardship, which could be in operational and embodied carbon, likely they will have their best and brightest staff, so comfort is top of mind;
- Developer Speculative buildings: For a developer making a core-and-shell seeking a tenant. First costs are critical, and a need to make their building flexible for different tenants while also comfortable, with low energy costs to attract a tenants.
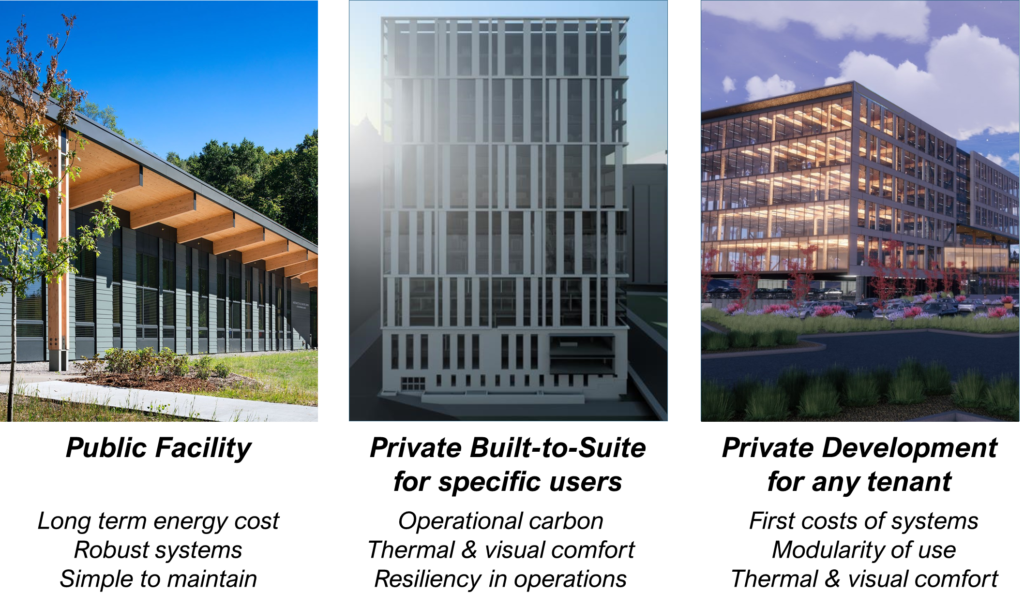
For each of these client types, focusing on their top values can help us focus on how we can use energy modeling and building analysis for designing great buildings.
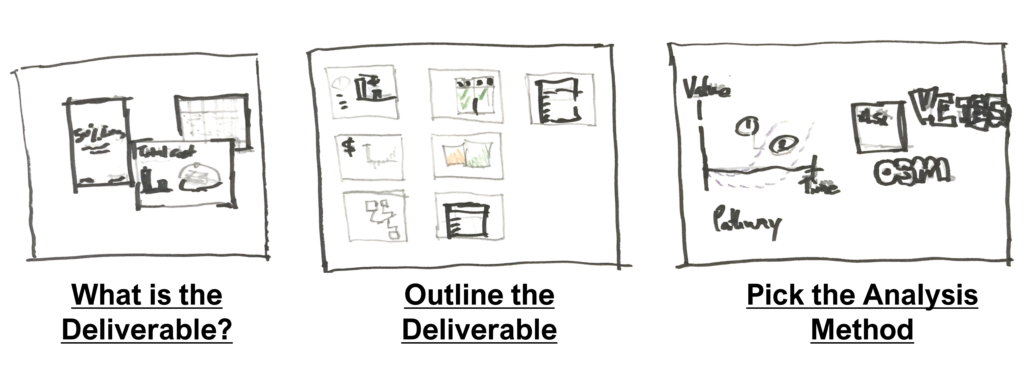
Once a general sense of values is identified, pick the right level of energy modeling needed, matched with the time available and the level of answer accuracy a project needs to make a decision. I always work backward in figuring this out, starting with:
- What am I delivering? A presentation, a report, a set of compliance documents?
- Who will be interpreting this information? Can I outline a report, do I want charts and graphs or renderings and diagrams?
- What analysis method is best? Do I need a full model, do I need a shoebox or one room? How much time do I have to do this?
By asking yourself these kinds of questions, you will be amazed at how much faster an energy modeling project can progress. And, like me, you will more than likely experience an increase in the level of understanding clients have for the information they get. There are two examples I would like to share about the work we did years ago on a public classroom building and a more recent project working with a spec building, developing a core-and-shell office building.
Public Environmental Classroom Center
In the public classroom building, the client was creating an outdoor environmental education center for students to come and spend a day learning about the region’s local ecology. The center sought to be net zero energy from the very beginning, knowing this would be the best for the environment and the lowest cost of energy for the building over the life of operation.
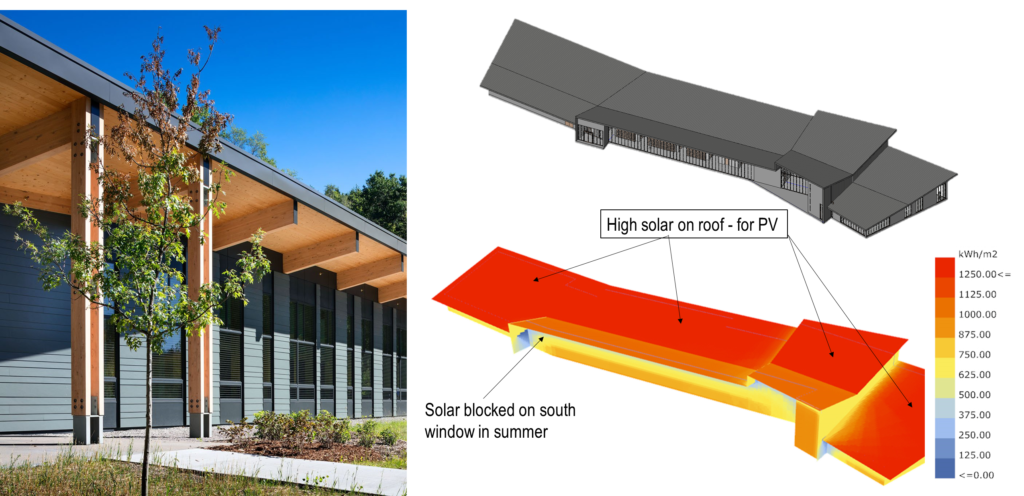
As the building massing took shape early in design, we quickly focused on our energy generation budget by looking at how much solar energy falls on the roof and what amount of coverage solar panels would give us as we aimed for a reasonable energy budget. This set a more tangible path for thinking about an energy number regarding the physical number of solar panels the project would need to buy. From there, the energy modeling focused on ways to drive the energy use down by starting with the local energy code minimum and working through envelope enhancements first, simple, robust HVAC and lighting systems second, with a continuous check in on the relationship of energy use to the quantity of solar panels needed.
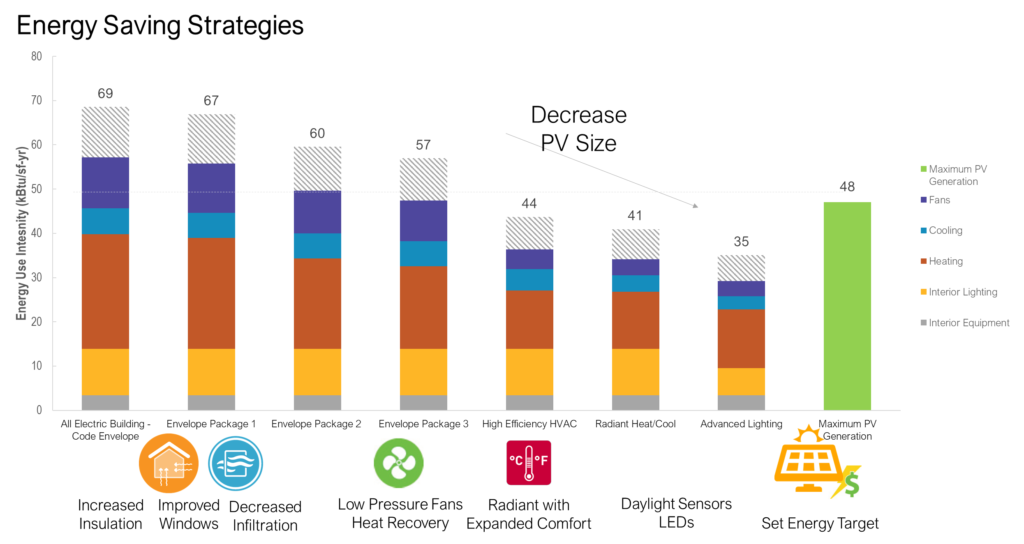
The team leveraged
OpenStudio to do the modeling, utilizing the many functionalities in the tool to iterate through different wall assemblies and systems. By doing this early in the project, the team was able to estimate the areas of energy usage.
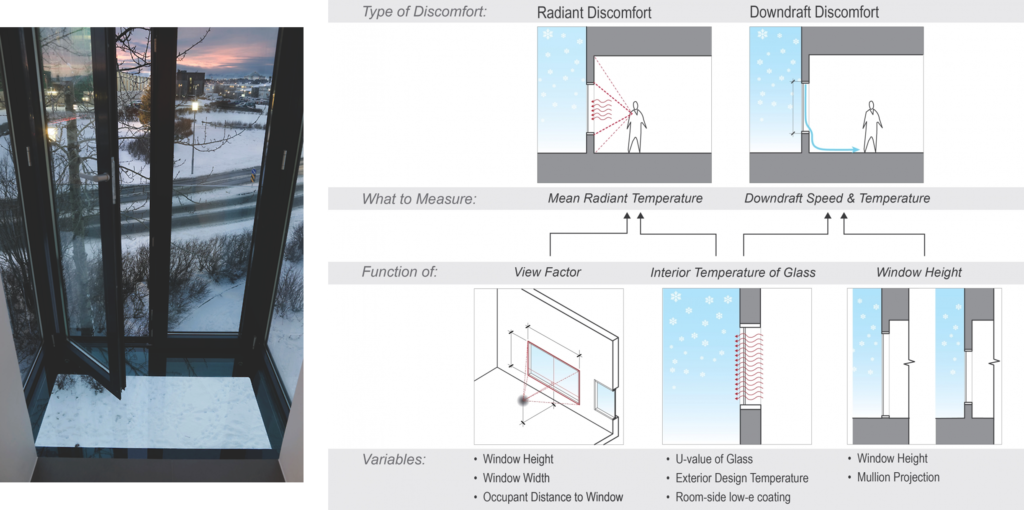
The building was located in the Pacific Northwest and did reach below freezing temperatures and would have periods with snow on the ground. Since the team knew kids would be sitting throughout the classrooms, often on the floors or near the windows, we used a light weight comfort assessment tool to evaluate different glass assemblies for cold comfort risks. Payette Architects have
an excellent online cold climate comfort assessment tool, where a shoebox room can be defined to evaluate a rather complex topic of radiant discomfort and downdraft discomfort, which can occur when windows are too cold.
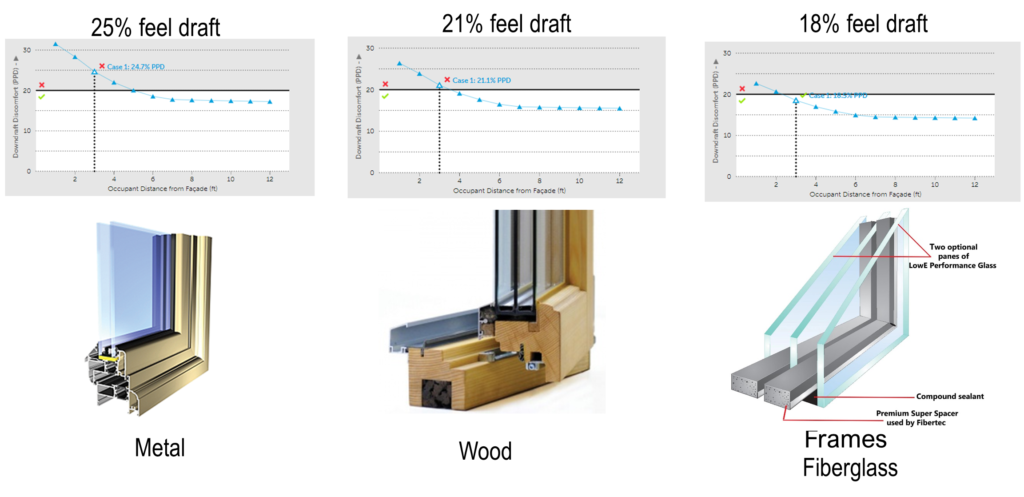
We evaluated three assemblies very quickly to be able to rapidly give the architecture team and owner a way to understand what each one could provide in reducing the discomfort risk. The charts provided tell the designer how close to the window someone could be before they would likely experience discomfort, with the examples below shown at 3 feet from the glass.
Recently, we assisted on a speculative office building project. The development team was focused on creating a high-end office space in a growing city to attract high end tenants. The building team had already focused on creating a hybrid structure of mass timber and steel to reduce the embodied carbon of the space and was now focused on other areas or ways to maintain their cost budget while ensuring the building could reach low energy goals and be flexible in use. Our energy modeling team utilized
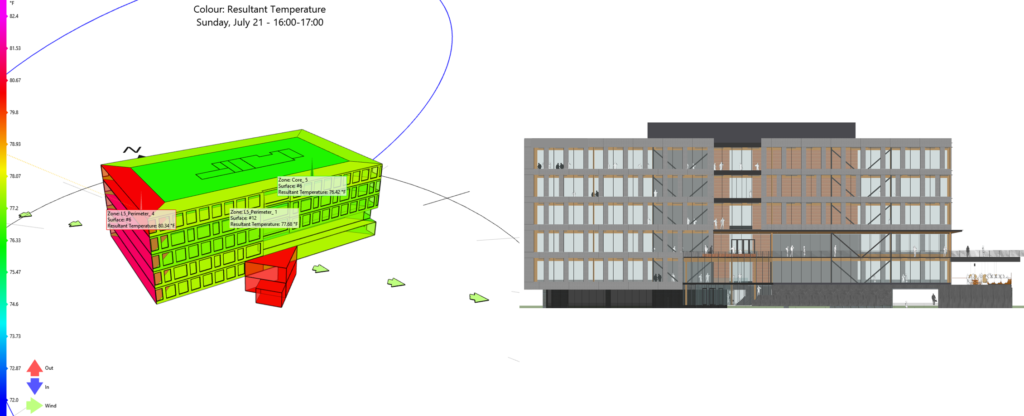
EDSL TAS to quickly generate a building energy model which could give us energy information as well as feedback on glare and thermal comfort.
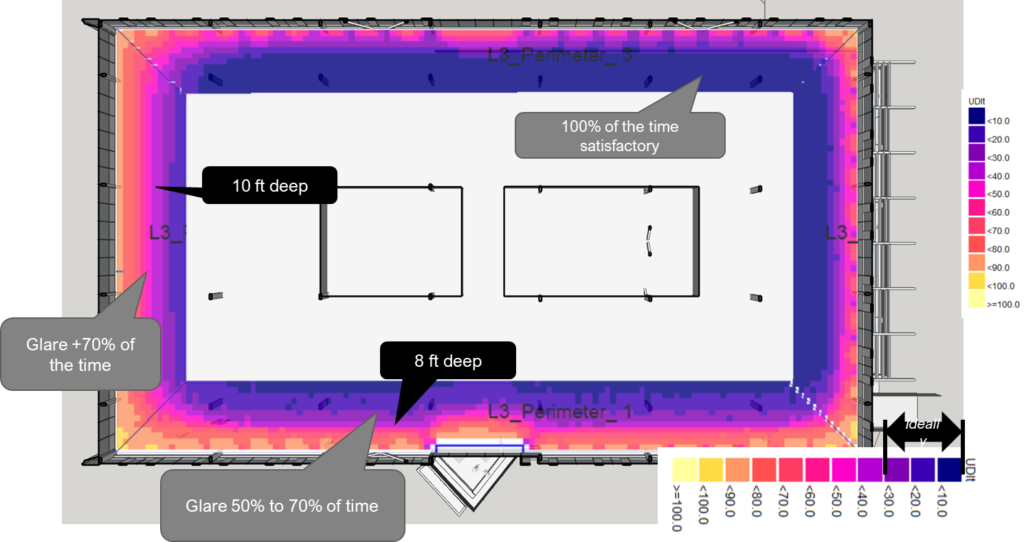
While the team did report annual estimated energy use intensity (EUI), we quickly pivoted to working with the team to enhance the façade of the building to reduce glare and thermal comfort risks, which could ultimately drive up energy use. The modeling results demonstrated how the building would have restrictive functionalities within the first 10 feet or more as designed with the current level of west facing glass.
We also focused on providing models and metrics for evaluating the thermal comfort of people using the space. For this we used a visual metric developed by Loisos + Ubbelohde called Thermal Autonomy (
https://www.semanticscholar.org/paper/Thermal-Autonomy-as-Metric-and-Design-Process-Levitt-Ubbelohde/f215938dac4c84d6a0698f21688e50849039879a). The visualization focuses on a relative answer of how often someone will feel hot or cold and by how many degrees.

Using this analysis overlay, combined with a moment in time rendering from TAS, we could anticipate that the room on the west side would be too hot 12% of the time the building was in use. Working to reduce the glass on the west could reduce this number to 3% of the time. What I love about this metric is it can be used with just the hours too hot and cold or go one level deeper and focus on how many degrees someone will feel beyond a range of comfort; in this example, more than +8 deg F for 17 hours.
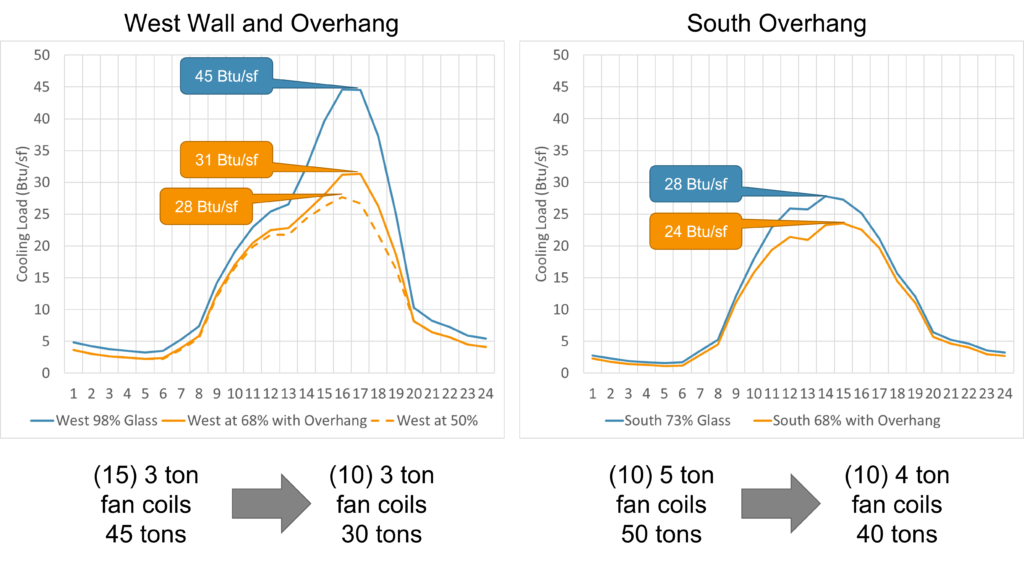
Beyond the user experience anticipated, we also realized the complexity and size of any mechanical system on the west façade would significantly increase if the cooling needs were too high and could directly drive up the project’s cost. While the energy model was not the final tool used to size equipment, using a model to demonstrate the load size and working through the saving’s improvements to a building’s envelope can result in traded-offs or reductions in mechanical systems. For this project, we pulled peak loads out of the west and south façade rooms and translated the information into a number the mechanical engineering team could utilize (BTU/sf) as well as summarizing it into the number of fan coils that would be required, which could be used by the contractor to estimate increased costs.
These are a few examples of how building energy models can be developed to align with a building’s use and the design team’s needs. While all energy models are based on building science and physics, our clients benefit when we translate information through visualizations, interpreting choices and trade-offs to meet their needs.


 At Red Car Analytics, we love our building energy models, although we are the first to admit that getting real value out of a model can be as much an art as science. I recently gave a presentation about finding the value in building energy modeling, sharing some of my experience working in this space for over 12 years. I hope that it will inspire others out there.
Energy modeling or building analysis has been around for a long time. Ultimately, the goal is to analyze ENERGY. Yet, there are many interpretations about what an energy model should illustrate. As an energy modeler, I remember thinking, ‘if only we could streamline our reports,’ or ‘if only we could teach everyone the same energy metrics,’ or, ‘if only our clients wanted all the values we could demonstrate.’ At one point, just to make sense of it all, I made a list of the different value propositions we have used over the years (shown in this word cloud).
It took me years to understand that while every project fundamentally might share the same aspirational goals (low energy, low carbon), clients have different priorities and motivating values. In the long run, their values are the most important as they make investment decisions and changes to a building. And, it’s not to suggest they don’t also want all the other values; usually, everyone does. However, the question becomes, are they willing to make changes to achieve them and whether it matters enough to spend the time and costs involved.
Let’s look at three examples of how different values might motivate different building design teams:
At Red Car Analytics, we love our building energy models, although we are the first to admit that getting real value out of a model can be as much an art as science. I recently gave a presentation about finding the value in building energy modeling, sharing some of my experience working in this space for over 12 years. I hope that it will inspire others out there.
Energy modeling or building analysis has been around for a long time. Ultimately, the goal is to analyze ENERGY. Yet, there are many interpretations about what an energy model should illustrate. As an energy modeler, I remember thinking, ‘if only we could streamline our reports,’ or ‘if only we could teach everyone the same energy metrics,’ or, ‘if only our clients wanted all the values we could demonstrate.’ At one point, just to make sense of it all, I made a list of the different value propositions we have used over the years (shown in this word cloud).
It took me years to understand that while every project fundamentally might share the same aspirational goals (low energy, low carbon), clients have different priorities and motivating values. In the long run, their values are the most important as they make investment decisions and changes to a building. And, it’s not to suggest they don’t also want all the other values; usually, everyone does. However, the question becomes, are they willing to make changes to achieve them and whether it matters enough to spend the time and costs involved.
Let’s look at three examples of how different values might motivate different building design teams:
 By asking yourself these kinds of questions, you will be amazed at how much faster an energy modeling project can progress. And, like me, you will more than likely experience an increase in the level of understanding clients have for the information they get. There are two examples I would like to share about the work we did years ago on a public classroom building and a more recent project working with a spec building, developing a core-and-shell office building.
Public Environmental Classroom Center
In the public classroom building, the client was creating an outdoor environmental education center for students to come and spend a day learning about the region’s local ecology. The center sought to be net zero energy from the very beginning, knowing this would be the best for the environment and the lowest cost of energy for the building over the life of operation.
By asking yourself these kinds of questions, you will be amazed at how much faster an energy modeling project can progress. And, like me, you will more than likely experience an increase in the level of understanding clients have for the information they get. There are two examples I would like to share about the work we did years ago on a public classroom building and a more recent project working with a spec building, developing a core-and-shell office building.
Public Environmental Classroom Center
In the public classroom building, the client was creating an outdoor environmental education center for students to come and spend a day learning about the region’s local ecology. The center sought to be net zero energy from the very beginning, knowing this would be the best for the environment and the lowest cost of energy for the building over the life of operation.
 The team leveraged OpenStudio to do the modeling, utilizing the many functionalities in the tool to iterate through different wall assemblies and systems. By doing this early in the project, the team was able to estimate the areas of energy usage.
The building was located in the Pacific Northwest and did reach below freezing temperatures and would have periods with snow on the ground. Since the team knew kids would be sitting throughout the classrooms, often on the floors or near the windows, we used a light weight comfort assessment tool to evaluate different glass assemblies for cold comfort risks. Payette Architects have an excellent online cold climate comfort assessment tool, where a shoebox room can be defined to evaluate a rather complex topic of radiant discomfort and downdraft discomfort, which can occur when windows are too cold.
The team leveraged OpenStudio to do the modeling, utilizing the many functionalities in the tool to iterate through different wall assemblies and systems. By doing this early in the project, the team was able to estimate the areas of energy usage.
The building was located in the Pacific Northwest and did reach below freezing temperatures and would have periods with snow on the ground. Since the team knew kids would be sitting throughout the classrooms, often on the floors or near the windows, we used a light weight comfort assessment tool to evaluate different glass assemblies for cold comfort risks. Payette Architects have an excellent online cold climate comfort assessment tool, where a shoebox room can be defined to evaluate a rather complex topic of radiant discomfort and downdraft discomfort, which can occur when windows are too cold.
 We evaluated three assemblies very quickly to be able to rapidly give the architecture team and owner a way to understand what each one could provide in reducing the discomfort risk. The charts provided tell the designer how close to the window someone could be before they would likely experience discomfort, with the examples below shown at 3 feet from the glass.
 Recently, we assisted on a speculative office building project. The development team was focused on creating a high-end office space in a growing city to attract high end tenants. The building team had already focused on creating a hybrid structure of mass timber and steel to reduce the embodied carbon of the space and was now focused on other areas or ways to maintain their cost budget while ensuring the building could reach low energy goals and be flexible in use. Our energy modeling team utilized EDSL TAS to quickly generate a building energy model which could give us energy information as well as feedback on glare and thermal comfort.
 While the team did report annual estimated energy use intensity (EUI), we quickly pivoted to working with the team to enhance the façade of the building to reduce glare and thermal comfort risks, which could ultimately drive up energy use. The modeling results demonstrated how the building would have restrictive functionalities within the first 10 feet or more as designed with the current level of west facing glass.
 We also focused on providing models and metrics for evaluating the thermal comfort of people using the space. For this we used a visual metric developed by Loisos + Ubbelohde called Thermal Autonomy (https://www.semanticscholar.org/paper/Thermal-Autonomy-as-Metric-and-Design-Process-Levitt-Ubbelohde/f215938dac4c84d6a0698f21688e50849039879a). The visualization focuses on a relative answer of how often someone will feel hot or cold and by how many degrees.
 Using this analysis overlay, combined with a moment in time rendering from TAS, we could anticipate that the room on the west side would be too hot 12% of the time the building was in use. Working to reduce the glass on the west could reduce this number to 3% of the time. What I love about this metric is it can be used with just the hours too hot and cold or go one level deeper and focus on how many degrees someone will feel beyond a range of comfort; in this example, more than +8 deg F for 17 hours.
Beyond the user experience anticipated, we also realized the complexity and size of any mechanical system on the west façade would significantly increase if the cooling needs were too high and could directly drive up the project’s cost. While the energy model was not the final tool used to size equipment, using a model to demonstrate the load size and working through the saving’s improvements to a building’s envelope can result in traded-offs or reductions in mechanical systems. For this project, we pulled peak loads out of the west and south façade rooms and translated the information into a number the mechanical engineering team could utilize (BTU/sf) as well as summarizing it into the number of fan coils that would be required, which could be used by the contractor to estimate increased costs.
Using this analysis overlay, combined with a moment in time rendering from TAS, we could anticipate that the room on the west side would be too hot 12% of the time the building was in use. Working to reduce the glass on the west could reduce this number to 3% of the time. What I love about this metric is it can be used with just the hours too hot and cold or go one level deeper and focus on how many degrees someone will feel beyond a range of comfort; in this example, more than +8 deg F for 17 hours.
Beyond the user experience anticipated, we also realized the complexity and size of any mechanical system on the west façade would significantly increase if the cooling needs were too high and could directly drive up the project’s cost. While the energy model was not the final tool used to size equipment, using a model to demonstrate the load size and working through the saving’s improvements to a building’s envelope can result in traded-offs or reductions in mechanical systems. For this project, we pulled peak loads out of the west and south façade rooms and translated the information into a number the mechanical engineering team could utilize (BTU/sf) as well as summarizing it into the number of fan coils that would be required, which could be used by the contractor to estimate increased costs.
 These are a few examples of how building energy models can be developed to align with a building’s use and the design team’s needs. While all energy models are based on building science and physics, our clients benefit when we translate information through visualizations, interpreting choices and trade-offs to meet their needs.
