
Top Stories From 2020

 Variable refrigerant flow (VRF) systems have become an increasingly popular all-electric building system used in low energy buildings in California and the United States. Questions we hear all the time are “how efficient is VRF?” and “how can I monitor these systems in my building?” In 2020, we took on these questions and sufficed it to say that it is possible. However, with the monitoring tools available today, the measurement of VRF operational efficiency is only practical for research teams and demonstration projects.
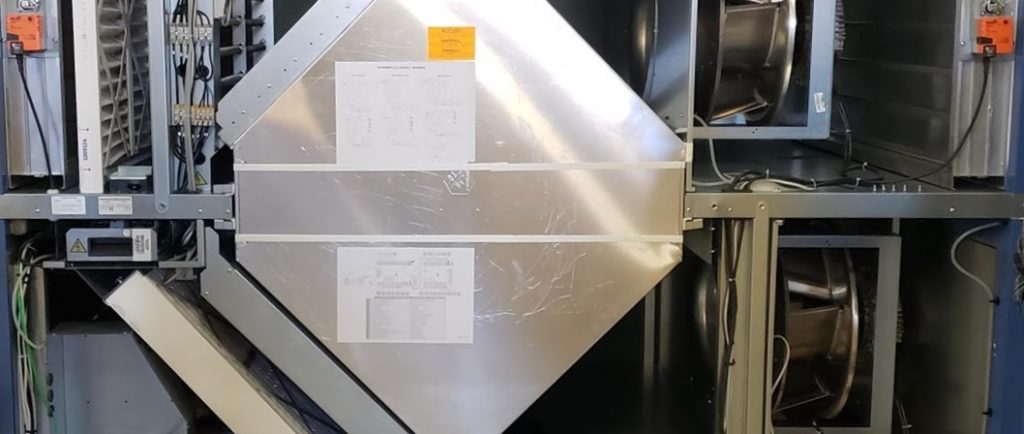
VRF systems are particularly complex to monitor, as they use refrigerant in their outdoor compressor units and distribution piping to zone fan coils throughout a building. Like any heat pump, the system uses a refrigeration cycle to move heat in and out of the building, and many are capable of providing both heating and cooling at the same time to different zones. A refrigerant cycle works on changing the state of the refrigerant between a gas and a liquid. In VRF systems, there are many cases where the refrigerant is a mixture of gas and liquid depending on the thermal loads, making it challenging to measure.
Most VRF systems can report out points to a building automation system (BAS) from their internal sensors, though on closer review these points are typically not enough to calculate thermal load or energy consumption. Further, many optional fault monitoring capabilities that manufacturers provide might be great for operators but often lack hourly historical data to review ongoing performance.
In researching monitoring solutions, our team decided to utilize a third-party refrigerant monitoring system which uses non-invasive measurement tools, including pressure probes in the equipment’s service ports and surface-mounted pressure sensors on refrigerant piping. The system measures the state of refrigerant at the inlet and outlet of the compressor and uses a high frequency electric meter to monitor the compressor power to approximate refrigerant flow rate. The combination of this data with the full unit power consumption provides a measure of operational efficiency. While this approach has its limitations, specifically it only works for one mode at a time (cooling or heating), we found this solution to be the best balance of measurement rigor and practicality, and we are excited to learn from these efforts.
 Heat pumps were a big topic in 2020 and continue to be on the hot plate for building design strategies in states looking to reduce carbon emissions, especially California. Though in Utah, the opportunities are just as strong and designers in the area are figuring out how to make these systems work even in a more intimidating climate.
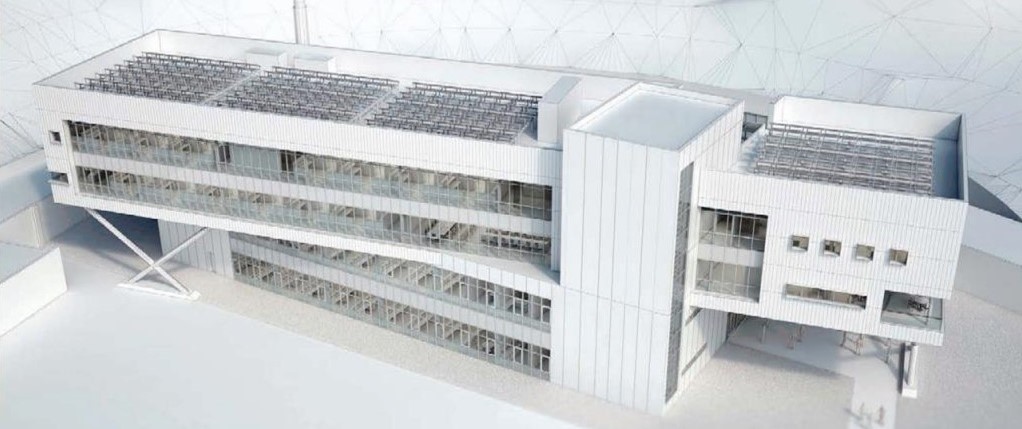
In 2020, Red Car Analytics had the opportunity to support an exceptional team of architects and engineers designing a new 400,000 sf office building for one of the larger investment banks behind large scale renewable energy projects. Looking to walk the talk, the project set out from the beginning to include ambitious goals of generating a substantial portion of energy on site and trying in all ways to reduce carbon emissions, both through embodied materials and operations. As part of the team, Red Car Analytics’ energy consultants helped to identify the economic benefits of designing the building to be all-electric, leveraging air source heat pumps for building heating and cooling. Even with aggressively low prices on natural gas, around $0.70/therm, a heat pump can still be the lower operating-cost heating source both with grid electricity and even cheaper when utilizing on-site solar PV.

The team helped to unpack the economics of this trade-off for the ownership team and evaluated the annual hourly grid energy costs, taking into consideration time-of-use energy costs, seasonal changing costs of gas, and weighing the operational efficiencies of a natural gas boiler vs. a heat pump for heating. For this building, the numbers made for a compelling opportunity to go all-electric, and we are excited to see the building move into construction in 2021!
![]() Most building owners we work with struggle to find the time to review the one or two energy bills they get each month, so imagine if your building had four or five energy bills?
Most building owners we work with struggle to find the time to review the one or two energy bills they get each month, so imagine if your building had four or five energy bills?
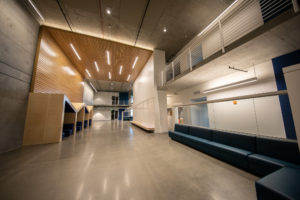
While many industry leaders are talking about buildings of the future that generate, store, and use energy on a dynamic grid, there are buildings out there today with this functionality, and we have had the pleasure of keeping tabs on them. Typically, most building operators are interested in understanding their true cost of energy. On our client’s campus, energy comes from on-site generation, including solar PV and fuel cells, and off-site sources from the utility grid and through a direct access agreement to third party solar farms. For any month there are about 4 or 5 data streams of information necessary to understand operational energy costs, and many bills are not available in real-time, sometimes taking weeks given the different billing cycles.
In the quest to optimize energy cost and efficiency of a campus, we must consider not only how much energy is being used by the buildings but also what type of energy is used, when energy is used, and how much energy can be produced onsite at a given time. This includes complex analysis of using historical time-of-use energy costs and predicted renewable production. To help a campus optimize its energy costs, our frame of reference typically focuses on several interrelated questions such as: Can we optimize onsite energy generation, and are systems fully utilized? Can we maximize energy cost between time of use charges, fuel types, and system controls? Can we enhance operational performance and make the campus more efficient, using energy wisely?
We are excited to see more buildings move toward this bright and dynamic future, especially as we continue to see building performance scale in these areas.
 In the building energy and air conditioning industry, acronyms and terminology are an everyday occurrence. In a research project with our friends at the Northwest Energy Efficiency Alliance (NEEA), we spent some time digging into the terminology surrounding air conditioning systems with separate ventilation, a.k.a. Dedicated Outdoor Air Systems or DOAS.
As it turns out, while DOAS as a term has been around for decades, its meaning can evolve and mean different things to different people. The confusion comes primarily from categorizing decoupled trends in HVAC in dry, West Coast climates where buildings might use a heat recovery ventilator (HRV), an energy recovery ventilator (ERV), or a direct-expansion-DOAS (DX-DOAS). We found that the term “DOAS” is often associated with DX-DOAS or units providing dehumidification primarily, and raising the question: “Should classification of ventilation units in decoupled air conditioning exist (e.g., HRV-DOAS, DX-DOAS)?” We think so. If for no other reason than to make it possible for more designers and energy efficiency advocates to understand these configurations, and as more building projects consider them.
 These days, buildings and the idea of big data for optimization are buzz words in our industry. Even our company name recognizes this! In 2020, we learned a few lessons on what can work and where to start. For many people we talk to, often the question begins with “What information should we monitor?” and “What key performance indicators (KPIs) should be used?” and “What type of dashboard is best?” If anything, we have learned that it is always better to start with who will use a dashboard or KPIs and their specific needs.
This insight of starting with who, while simple in retrospect, is incredibly important. Especially when buildings take on creating KPIs and integrating data sets from multiple sources. We predict most building operators spent a fair bit of 2020 asking:
“Where is the data in this system stored? Why can’t we see it on this other dashboard? Who in our company has access to change this?”
Once some large hurdles of access are cleared away, we have seen the highest success in using building dashboards when they are focused on the needs of very specific building operators, starting with just optimizing how a building runs. Through focusing on optimization of systems being on or off, or simply used to provide the best indoor environment, we have seen teams rally behind their dashboards. And the fun fact is that most of the time, the building gets more energy efficient in the process. After optimization, the second lesson we learned was the attention to information standardization and data visualization as a way to teach new members of a facilities team who may be less building-savvy or unfamiliar with a new system. Having a standard way of reviewing an air handler unit’s operations can align the whole team to know what to look for and what information to share quickly and efficiently.
In a building lighting and HVAC have historically remained separate systems without a need to communicate with one another. Nevertheless, times are changing, and although each of these systems have advanced in efficiency independently, there are additional energy efficiency synergies when they can be integrated.
In January of 2020, California’s 2019 Building Energy Efficiency Standards (Title 24 Part 6) introduced a new mandatory requirement into code called “Occupied-Standby Mode” requiring many spaces to reduce HVAC ventilation to zero airflow when lighting or dedicated occupancy sensors detect the space is vacant (refer to Title 24, Part 6, Section 120.2(e)3). This simple concept sounds like a guaranteed energy efficiency measure with a lot of potential to save energy; however, successful implementation requires careful planning and coordination among disciplines, starting early in the design phase.
Today’s building systems have increased complexity, and because of the propriety nature of most lighting systems, a single construction team member cannot have all the expertise necessary to provide the level of quality assurance needed for most buildings. This is why commissioning is a collaborative process that requires a team of individuals to be involved from the beginning to the end of the project. Both electrical and HVAC engineers should recognize they are “key” members on this team and include time and budget to support the commissioning process adequately. Having completed commissioning on four buildings prior to the occupied-standby code requirement that have attempted to implement this, we would argue that it is not an easy process to reach a successful outcome. Our top advice from these efforts for future endeavors is:
- System zone maps are gold. One for HVAC, one for Lighting, and one for both to indicate zone sensor controllability.
- Delegation of system integration is a must. Someone must program the data from one system to the other and chances are, it varies by the type of HVAC and lighting system selected.
Design documents should include sequences of operations for all systems, including lighting. The best buildings can also include design intention narratives for building operators to quickly orient them.

2020 brought us a compelling challenge to learn about our indoor air quality and air safety in our small office. The office is naturally ventilated, with windows on either side for cross ventilation. Early in the year, we bought a small-scale indoor air quality sensor that measures the temperature, RH, CO2, VOCs, and PPM levels. Over the past few years, we have had a small in-room air filter running and in the summer we have added a swamp cooler to provide us with some cooling.
By July and August of this year, we were working in shifts with people wearing masks all day, doing our best to keep our distance, and keeping the windows open, moving the air through the office.
By fall, our office, located in Santa Rosa, CA, was suddenly faced with another challenge of smoke-filled air from wildfires, creating a situation where we had to close windows to protect our air quality! One smokey hot day, we had three people working, all wearing masks for COVID and running our in-room air filter. By mid-day, the CO2 level reading from our indoor sensor had risen above 1200 ppm, but our only source of fresh air was outside. We decided to run an ‘office purge’ to get the indoor air quality back in line, which required each of us to put on an N-95 mask under our COVID masks. We then opened all the windows and the door, running the fans for 10 to 15 minutes to flush out our high CO2 levels. This, of course, introduced a high particulate count from the smoke in the air. We then shut the windows and door, turned our in-room filter unit to full flow and ran the swamp cooler to do what it could to clean the air.

We ran our experiment for nearly 30 minutes, acting as the louvers and control system, and in what can only be described as ‘organized chaos,’ we all endured the noise. It worked! Our indoor air quality sensor guided us through the process, tracking our indoor CO2 and ppm.
 If 2020 taught us anything, it was how to work smarter, especially with more challenging site visits and the new reality of working from home all the time. In this process of learning and revising our virtual interaction methods, we also put a lot of time into devising smarter strategies to approach the core our analytics work.
In January of 2020, we put a big focus on scaling our abilities to use a data analysis tool called Tableau. Although our team had used this for years previously, in 2020 we found synergies for organizing data, leveraging everyone’s skills, and working as a team on making a workbook come together. We created a common framework or language to describe our use of this software, and we were able to see our strengths and teamwork grow as we got further into using Tableau for more of our analysis.
In our energy modeling efforts, the team focused on further expanding our toolsets and abilities. The team leveraged a wide community of friends to help take on and learn how to batch process and generate EnergyPlus files and results, using the software ModelKit developed by Big Ladder. This software lets a modeler define parameters to use as parametric points, allowing a small set of energy modeling input pieces to turn into a large batch of energy models. This is incredibly powerful when investigating efficiency enhancements for whole building stocks or regions to understand what the market potential energy impacts could be. As we use these tools, we want to thank everyone who helps share workflow and best practices about working smarter verses harder.

Years ago, when our team first ventured into the world of verifying the rated efficiencies of HVAC equipment, a question surfaced regarding types of consumer protection and the value of such. At the time, aside from the unit type and the typical efficiency range, we honestly did not know much about the metrics and the tests used to create them, e.g., metrics like SEER, EER, IEER, IPLV, kW/ton. Fast forward to 2020, and our team is now putting together field studies, collaborating with testing labs, and seriously interested in how a metric can impact consumer choice.
At a quick glance, one product’s metrics based on testing procedures can appear like another yet are not. For example, some test procedures run the unit through a dehumidification mode, while others do very little dehumidification. For this reason, we think it is essential for building owners and design engineers to candidly ask and understand what a published efficiency metric means and consider whether the test procedure is useful for the application under consideration.
In 2020, we were able to get some of our first insights into HVAC efficiencies from measurement in the field, and we were quite excited! In general, field operations should be and often will be lower than efficiencies in a lab. Still, this new data has us excited to see how the relationship between rated and operational efficiency looks, especially as we add more sites to our studies. As we advocate for more low energy, net zero energy buildings, ensuring higher efficiency ratings and creating maps to higher performance are ways to improve all buildings.

At Red Car Analytics we spend a lot of time analyzing energy submeter trend data, both from permanent submeters part of a building’s design and temporary monitoring for research. A few lessons learned stand out that can be applied for any type of submetering effort:
- Submeters are not typically commissioned, and there is no standard protocol for validating submeter readings. The most reliable way to commission submeters is to apply a known fixed load to the submeter’s circuit (e.g., a load bank). If a load bank is not practical, validating the submeter with a secondary handheld power meter is also a great way to check that a submeter is recording accurately.
- Matching the submeter’s capabilities, including the type of power measurements and how the data is translated within the meter, to how submeter data will be used is important. For example, many power meters trend 15-minute rolling average power demand data, which is perfectly suitable for most applications and meets most owners’ needs. However, if detailed equipment performance, including power demand profiles, are the focus of measurements, then selecting power meters that can record instantaneous power is important.
- Comparing submeter data to utility whole-building electricity meter and natural gas meter data is a simple way to validate submeter data. However, utility meter readings cannot always be taken at face value, and practical experience is also important. On two different client buildings we worked on this year, the utility’s natural gas meter readings were much lower than heating system boiler submeter readings. Typically, utility meters are deferred to for accuracy over submeters; however, in both cases we identified that the utility meter data was about 100 times lower than benchmarks in similar buildings, so the utility data was disregarded. Eventually the utility company identified that their meter multiplier was incorrect and made the correction.


